

(This is Part I of a two-part blog series).
I have been a hands-on data person ever since I entered the business world in the late 1990s. While I used to view “all that data stuff” as tedious, over time I came to relish in the power that a good analytical tool offers – when in the hands of an experienced user.
My Excel Beginnings
For well over 25 years, Microsoft Excel has served millions of businesspeople, engineers, scientists, students, and personal users – myself being one of them – as a reliable, steadily-evolving spreadsheet tool. It has become the de facto standard for spreadsheet applications (with some growing competition in recent years from Google Docs).
![]()
People use Excel as a multipurpose data tool of sorts, including for tasks as various as: for recording raw data, performing calculations, building proformas, performing data visualization, and sharing data with others.
I estimate that I have conservatively spent at least 15,000 hours using Excel since I became a regular Excel user in 1997. Since that time and thousands spreadsheets later, I have honed my Excel skills in a way that has increased the speed, breadth, complexity and accuracy of my analyses. As a data scientist and advertising agency owner who uses Excel to solve problems for my clients and for my own companies, I can safely say that I qualify as an Excel power user, especially in the context of business applications.
Excel features a ton of built-in tools that make the life of a data scientist and business analyst easier. When it comes to building formulas that do cool things, it features about 450 built-in functions. These functions enable users to perform complex statistical, mathematical, engineering and text-manipulation tasks much faster.
The Evolution of My Excel Usage
While the reality of the progression of my Excel knowledge was nonlinear, here is a general sense of how things evolved for me:
1. Database: I started using Excel while working as a marketing coordinator at a Japanese truck parts depot located in Southern California. I mainly used Excel to catalog raw inventory information that would then be fed into more sophisticated inventory management software on premises. Basically, Excel served as a simple database. Excel was a convenient set of columns and rows for recording fairly inert data points.
2. Simple proformas: When I earned my MBA in the late 1990s, I learned to use Excel to build simple proformas – projections of “how things might go” given certain conditions. I also used it to perform simple financial calculations. Excel was a way to test different scenarios or outcomes based on numerical assumptions.
3. Inferential statistics: For my doctoral studies in the early 2000s, I used Excel to organize and codify qualitative survey responses as part of my dissertation research. I then built simple statistical models such as chi-square tables in Excel to test the relationship of variables observed against expected results. Excel became an easy way to calculate statistical averages, medians and correlations.
4. Data visualization: As I launched more heavily into my marketing career while working for a top global computer manufacturer in Japan in the early 2000s, I exercised my visualization skills: building tables, graphs and charts to demonstrate to my boss in fancy reports how our marketing efforts were performing. Excel performed as a way to communicate data concepts to others visually for easier understanding.
5. Data aggregation: Upon founding my first data-driven advertising agency in 2009, I then progressed into the world of data aggregation and summarization with Excel’s Pivot table feature. This involves summarizing – counting, adding, or averaging – thousands of rows of raw data into meaningful, high-level descriptive statistics. Excel became a way to quickly summarize raw data for the purpose of business intelligence. (The magic of the Pivot table still beguiles me today!).
My Introduction to Python
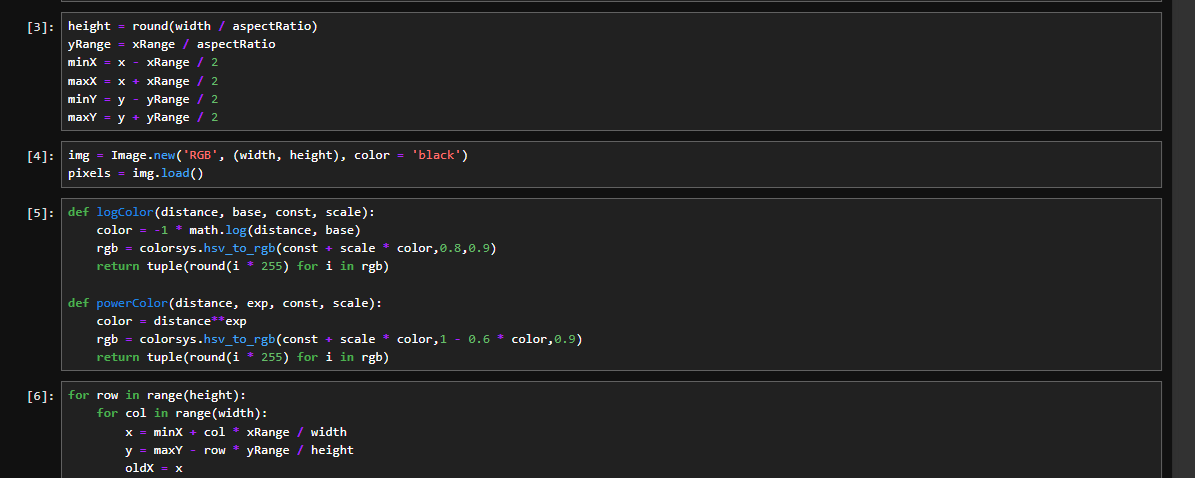
In the mid-2010s, I started to become curious about other ways to handle tackling data analysis beyond the spreadsheet. To scratch that itch, I downloaded and started playing with Python – one of the world’s most popular general-purpose programming languages. I soon realized that one of its libraries – called Pandas – could manipulate data much like a spreadsheet, but in a more code-based way. Python commands were all done with lines of code instead of the visual graphical user interface one gets with Excel.
![]()
A key library in Python is called Pandas. It deals mainly with a construct called a DataFrame. In many ways, a DataFrame works and behaves a lot like a spreadsheet. But in the hands of Pandas, it is much more powerful in many respects. Unlike with Excel, to “see” the data in Pandas, you have to run commands to print out certain subsets rows based on row positions or based on row values. Pandas operates “in-memory,” which means it stores the data in your computer’s RAM rather than accessing data stores in your hard drive or from the cloud.
Learning Pandas in Python was slow going at first. As a person who hadn’t done any programming since the early 1980s when I was a decent Basic programmer as a preteen, programming just hadn’t been in my life. To use Pandas, I had to learn the basics of the Python language and then learn how to apply the dozens of possible commands available in Pandas to my client’s problems and needs.
Progressing in Pandas
I started my use of Python by using commands piecemeal through the command line. The command line is a simple user interface the bypasses the normal operating system interface on all computers.
In 2016, I discovered a very useful tool called the Jupyter Notebook. This is an environment in which a user can build an entire programming script – or program – in pieces or chunks. In Jupyter Notebook, you can build one piece of code at a time and run it to see how it performs and whether you made any errors. My adoption of Jupyter Notebook significantly accelerated my Pandas journey. It felt more like a playground than a workstation.
Soon, I was building client-facing projects using Python – including Pandas and other libraries like Sci-Kit Learn – in Jupyter Notebook. Examples of typical projects for which I have used Jupyter Notebook include:
1. Creating scripts to combine multiple, similarly-formatted spreadsheets very fast: Ingesting CSV or Excel files from a folder, removing unwanted rows and columns, then combining them into a single file (or DataFrame) before exporting back to Excel – with the push of a button.
2. Building machine learning models: I had been building machine learning models using neural networks for years, but I had previously only used proprietary neural network software that required a license fee. With Python, I now had access new set of tools that gave me more control. And, I could combine data cleanup, machine learning, visualization and output to external files like CSV all with the same script.
3. Performing multi-step data manipulation steps: I combined data from multiple sources, ingested them into a Pandas DataFrame, and then performed calculations on the rows or columns. This often included removing unwanted characters or text strings, replacing strings with other strings, performing calculations on columns, and removing rows with null values in one or more cells.
My Analytics Toolkit Today
To date, I have studied, played with and used Python for file manipulation, data cleansing, machine learning and visualization for easily over 1,500 hours. While this pales in comparison to my Excel usage, it is a significant enough amount of time that I can safely draw some comparisons between these two data science and analytical powerhouse tools.
Despite my heavy Python use, I still use almost Excel daily. And, I find myself continuing to use Python frequently, as well. And tools like Google Sheets, but that’s for another blog.
I have come to a point where I am able to quickly discern which tool is best for a given task.
So, how do I differentiate between these two analytics tools on a day to day basis as a data scientist? How do I know intuitively which one will be right for the given project, as a seasoned data scientist with working knowledge of multiple tools? Read on!
Stay tuned for Part II of this series to read about my conclusions and take-aways about when and how to use these two uber-useful tools.